Experts Tracked How Fast Greenland and Antarctica's Ice Is Moving — the Numbers Are Alarming
Published Jan. 13 2026, 6:55 a.m. ET

Ice velocity on Jakobshavn Glacier in Greenland, 2014–2024
If you have eaten ice cream, which you probably have, then you would know how it melts. It doesn’t crack all of a sudden and tumble down. It melts slowly, softening at first and then dribbling down quietly like a creeping river that soon trickles down your arm and lands on the floor, forming a colorful puddle. In a study published in Remote Sensing of Environment, scientists documented the melting of two of the biggest ice sheets Earth cradles in its cart: Greenland and Antarctica. By analyzing the melting ice of these two bigwig ice-creams, they compiled an “ice speed report” that provides invaluable pointers for assessing climate dynamics, creating sea rise models, and predicting Earth’s geological future.
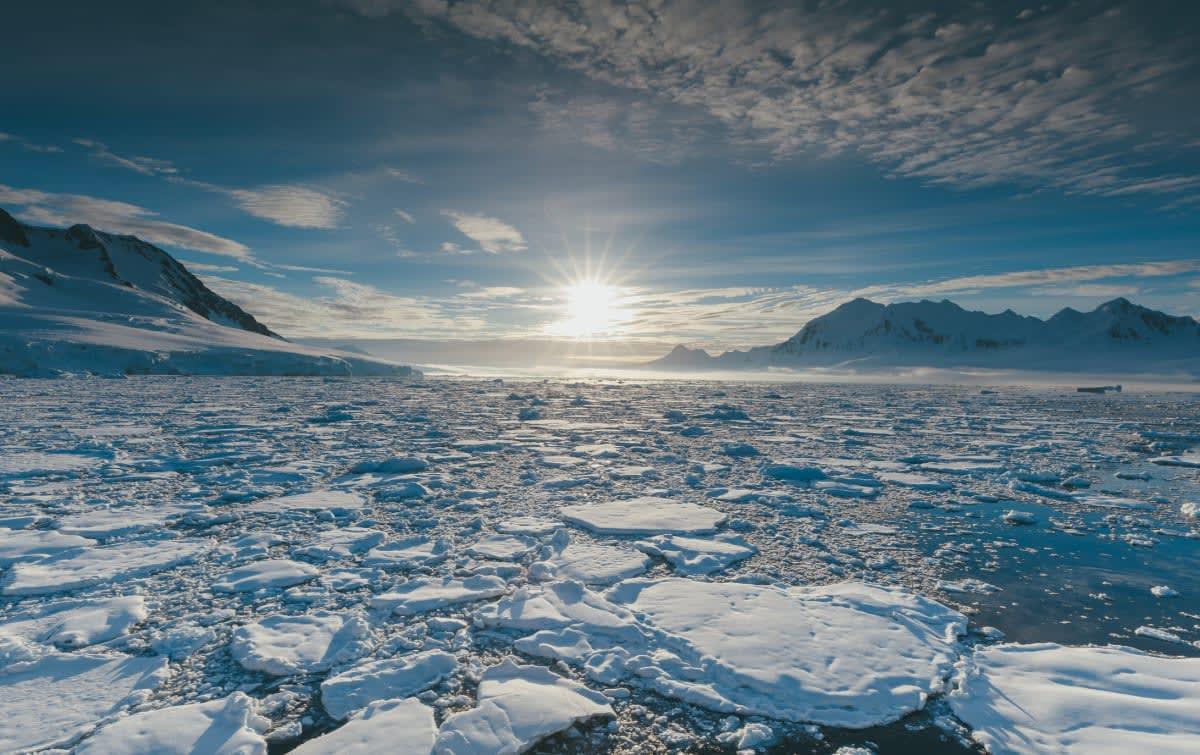
An Antarctic peninsula glimmering in sunlight, surrounded by sea ice
A few years back, scientists jumped through the hoops to monitor the changing states of polar ice. They would dig metal stakes in the ground and constantly measure their levels to record the shifting ice mass, braving the stinging cold. They dug endless snow pits, examined ice cores, gauged streams, took aerial photographs, and kept their nose to the grindstone to keep a track of the changing weather. Ever since the Copernicus Sentinel-1 (S1) mission was launched in 2014, scientists have found a way that is quick and easy.
Like eyes of the Earth, a constellation of satellites hovering around in space keeps a constant track of the ongoings of polar ice. By registering every little crevasse, rift, ripple mark, and speckle pattern, it provides a wealth of information about flowing ice. From day to night, from night to day, these satellites spy on ice’s movements, recording them in stop-motion animation-like frames. In the ground control centers, scientists collect this information to generate scatterplots, ice sheet-wide mosaics, velocity maps, and ice gridded maps.
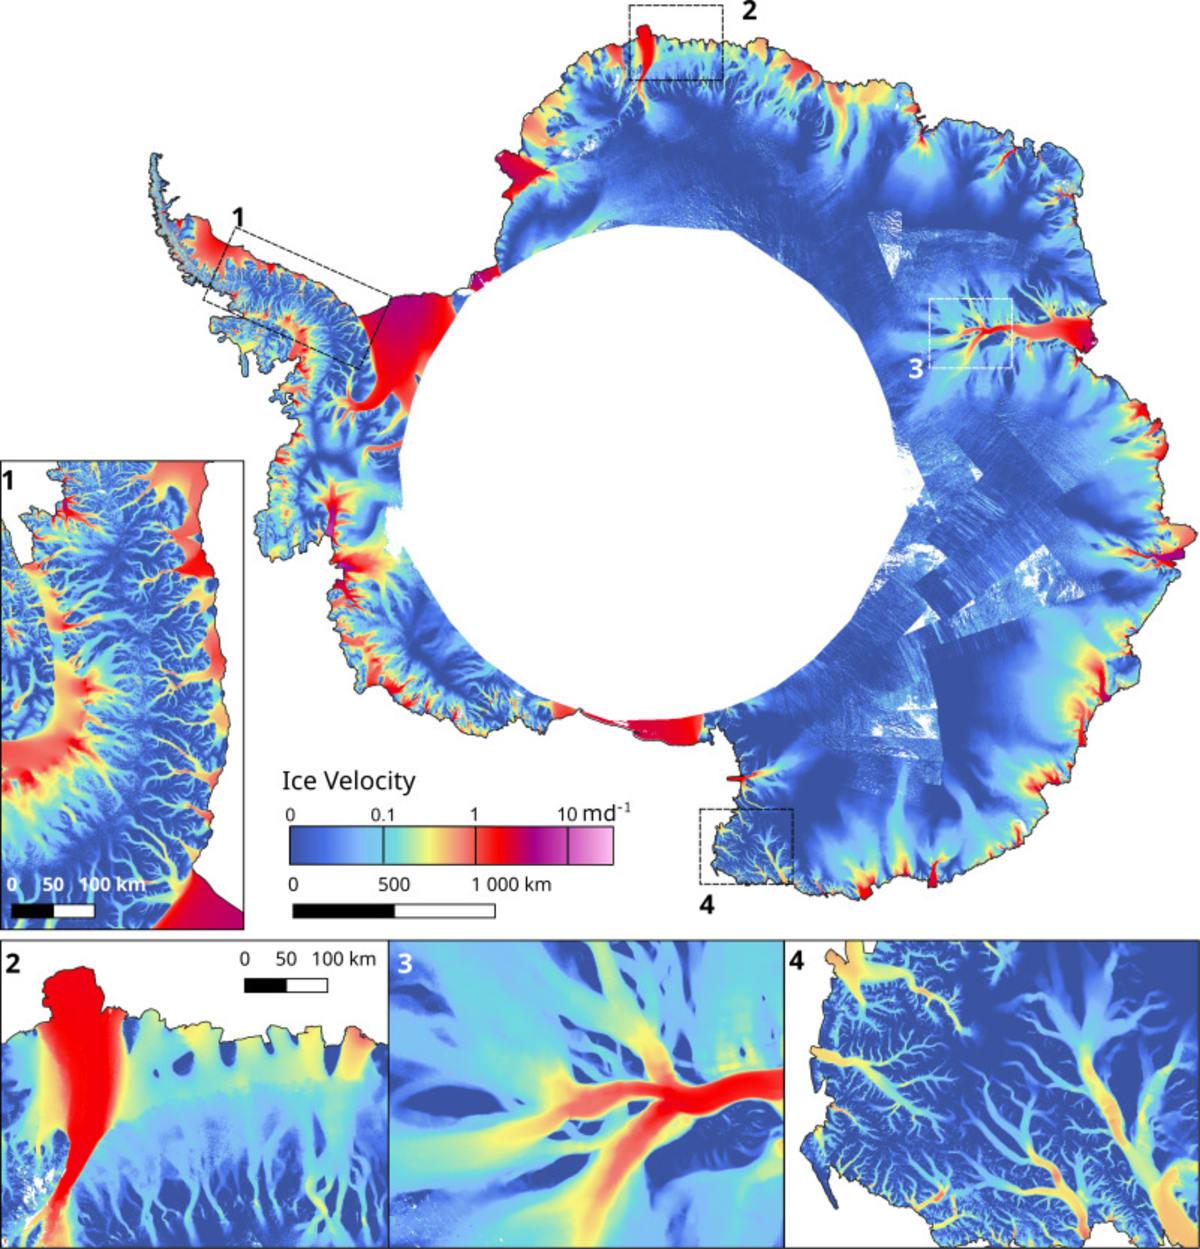
Antarctic ice velocity derived from Sentinel-1 SAR data of the period 2014–2024.
In this study, too, the team exploited the extensive 10-day archive made from the satellite acquisitions and documented Antarctica and Greenland in terms of their “ice loss” and “ice speed,” a key parameter in measuring the effects of climate change. According to the European Space Agency (ESA), this study is the “first continuous, high-resolution record of the ice-flow velocities across the Greenland and Antarctica ice sheets.”
The findings were made possible thanks to Sentinel-1’s synthetic aperture radar (SAR) instrument, precise orbit files, ice-ocean masks, and digital elevation models (DEM). The state-of-the-art SAR instrument is equipped with a C-band that enables it to capture high-resolution imagery for continuous monitoring despite heavy rains, smoke, lack of sunlight, prolonged darkness, and cloud cover. Every 6 to 12 days, it sends data to the scientists, including important glaciological variables like ice velocity and ice discharge.
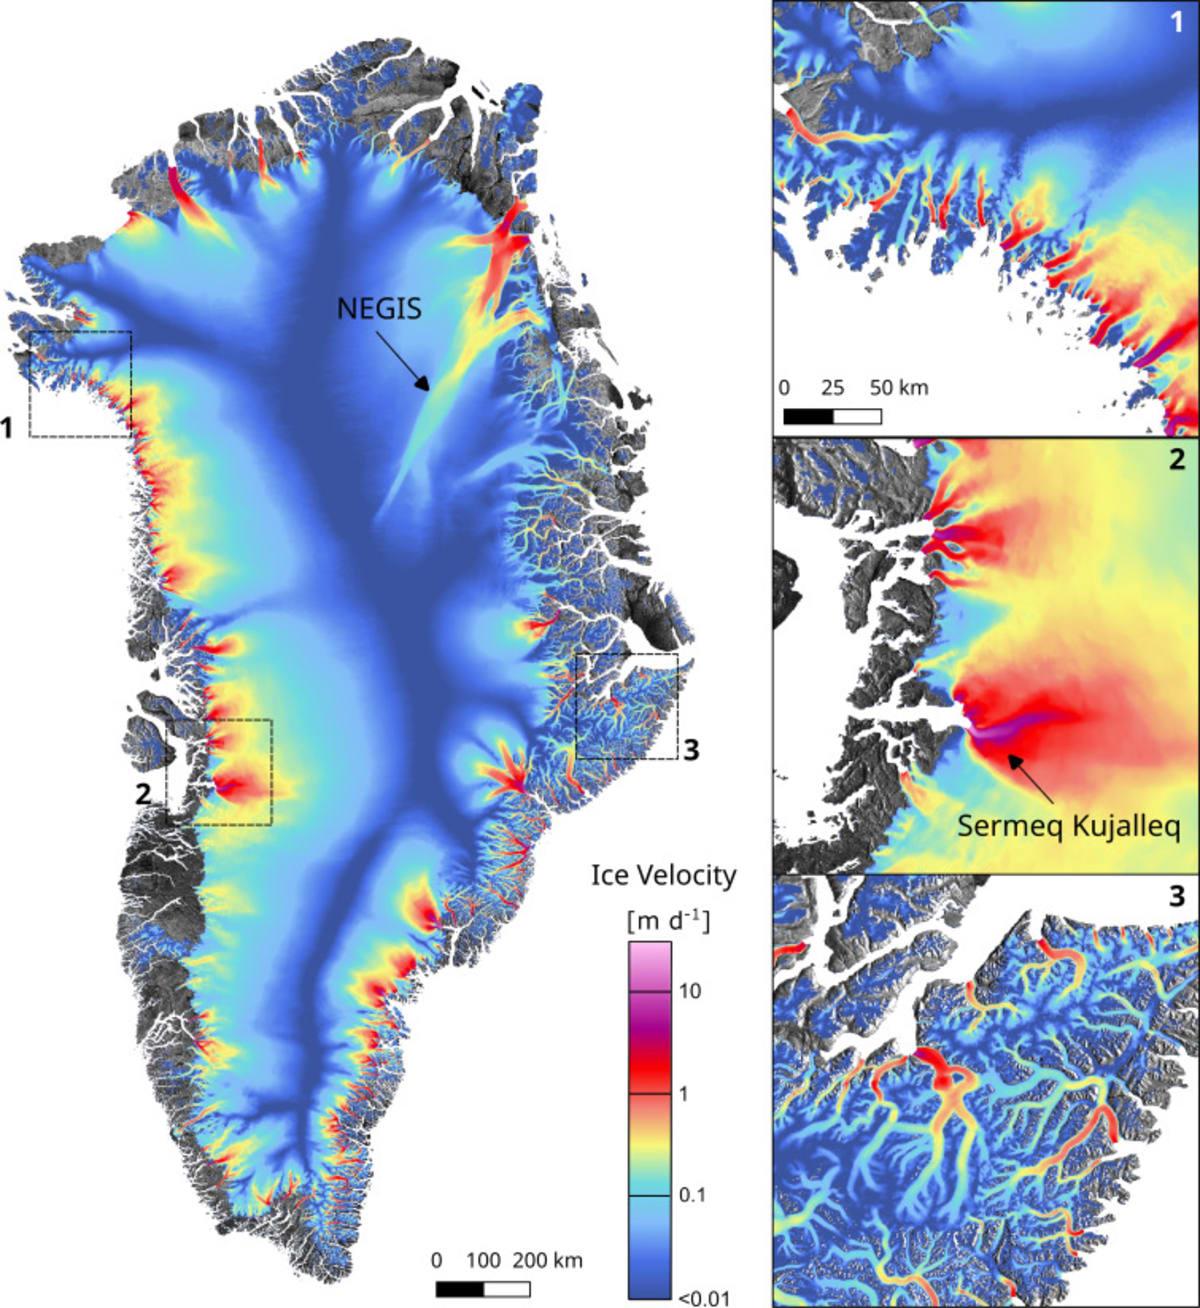
Greenland Ice Sheet ice velocity derived from Sentinel-1 data acquired from 2014 to 2024
For this study, the maps that scientists created using this data showed ice moving as slowly as approximately 3 feet per day and as fast as about 50 feet per day in certain places. In West Antarctica, the Pine Island Glacier showed signs of speeding up, even accelerating, from approximately 34.8 to 41.7 feet per day. On the other side, the Jakobshavn Glacier, one of the world's fastest outlet glaciers, sometimes showed velocities reaching about 164 feet per day.
These ice speed maps are illuminating pellets of information that will tell scientists the details of interannual changes, long-term trends in ice flow, changing boundary conditions, instabilities in ice shelves, collapsing ice tongues, iceberg calving cycles, glacier surges, ice divides, and other vulnerabilities. Because, as Nuno Miranda, the mission’s manager, reflected, "It is an essential tool as 2025 marks another record-breaking year of Arctic warming, where rapid changes demand closer and more frequent observation." As the frozen giants become more and more vulnerable to disintegration and collapse, they need more frequent and deep observation than ever before.