Experts Mapped 13 Years of US Co₂ Emissions — and It Shows Just How Bad the Problem Is
Published Dec. 18 2025, 8:47 a.m. ET

Climate scientist demonstrating data related to environment
If scientists made a list of the top five problems faced by the world today, global warming would probably be at the top. And the top factor that is responsible for global warming is carbon dioxide; in other words, humans. While many of us may not realize it, each time we add plastic to our shopping cart, each time we burn industrial oils, we are slowly, subtly ravaging the environment. The very environment that supports our life. In a new study published in Scientific Data, researcher Kevin Gurney documents 13 years of greenhouse emission data he and his team have curated as an eye-opening insight for everyone to see, reflect on, and act upon.
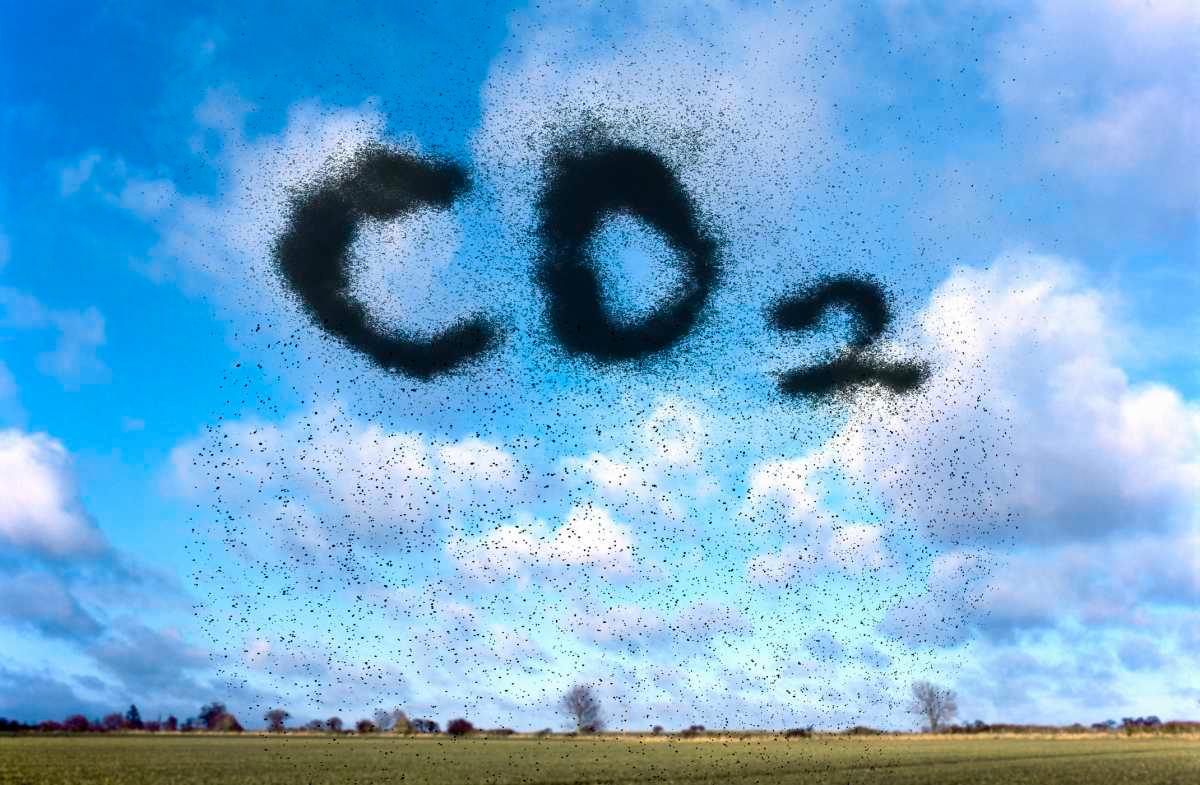
Image showing Earth's atmosphere with smoky letters that say carbon dioxide
Gurney, a Professor of Northern Arizona University’s School of Informatics, Computing, and Cyber Systems, has spent over two decades developing intelligent systems to track greenhouse gas emissions so the data can bring some awareness to the masses and help them make better choices. Under Trump’s administration, the funding that is allocated to climate research is greatly restricted. Despite such hindrances, Gurney and his team continue to optimize and upgrade their climate research systems, especially those related to greenhouse gas emissions.
“The U.S. taxpayers have a right to this data,” Gurney rebels, according to the press release, “In spite of the science funding cuts and threats to federal science data reporting, my team will continue to produce and share data critical to climate change and environmental quality. With the proposed rule to end the United States Environmental Protection Agency greenhouse gas reporting program, this data is more important than ever.”
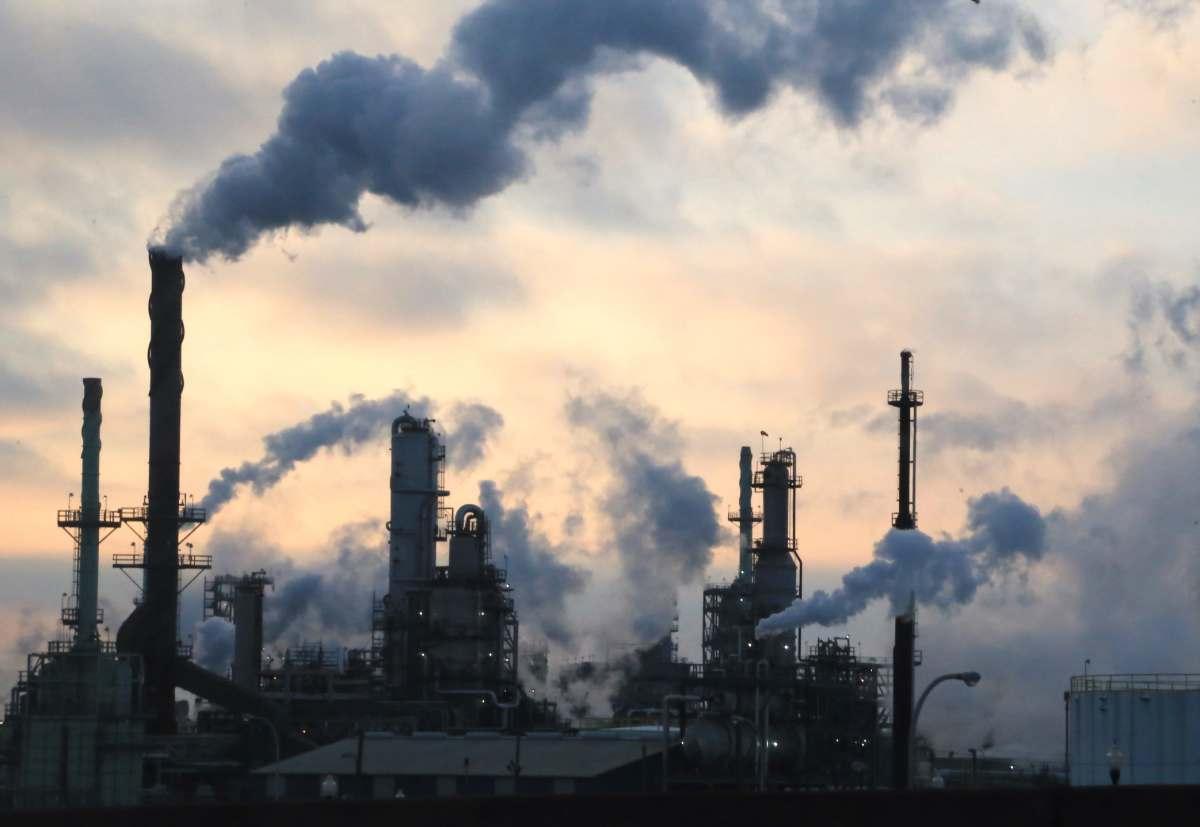
Smoke billowing from fossil fuel factories showing human-caused climate change
Two of his projects funded by federal agencies, Vulcan and Hestia, have revealed some striking outcomes over the years. In the current study, he presents version 4.0 of the Vulcan project. The project presents a record of carbon dioxide emissions in the United States, monitored between 2010 and 2022. The 13-year data registers every little detail down to the brass tacks. The report captures “CO2 emissions at unprecedented resolution—down to every city block, road segment and individual factory or power plant,” explained Pawlok Dass, a researcher and co-investigator in the study.
The top two sources of emissions were registered from fossil fuels and cement production. Based on the geographical area, the sources were classified into “point” and “nonpoint” categories. The “point” areas are those that are narrowed down to a specific block, whereas the “nonpoint” category areas are those that are scattered. For example, the electricity plants, airports, railroads, commercial marine vessels, and nonroad territories all come under the nonpoint category.

Donald Trump announces US withdrawal from Paris Climate Agreement.
But like every technology, it takes money, a lot of it. And this money has to come from the government that is responsible for caretaking the Earth’s atmosphere. In the Lost Science series of the New York Times, Gurney confessed that budget cuts have a significant and worrisome impact on climate research. Dass pointed out that the extensive record of data comes down to many terabytes, which requires a high-performing computing system, which is again a lot of budget. Yet, Gurney and his team are keeping on.
“We all remain committed to this research,” asserted researcher Bilal Aslam. “Rather than ignoring or suppressing this type of climate data, policymakers should seize the opportunity to create trading markets and climate-friendly investments.” At the end of the day, it’s not just one person who will benefit from this research; it’s the entire planet. The climate scientists, the urban planners, the environmental policymakers, the industry leaders, and down to a small householder.